Herculean efforts to keep cargo moving over the past few years have left a big imprint on U.S. cargo flows, port and real estate data show.
Shippers, seeking reliability in their supply chains since the onset of the COVID-19 pandemic, have taken major steps to reconfigure their logistics networks. Many diverted cargo over the years, fleeing congestion at large gateways or the risk of labor disruptions at West Coast ports. Others are simply moving closer to their customers, using ports and opening facilities near fast-growing population hubs to lower logistics costs.
Dozens of ports nationwide benefited from this combination of trends. But where exactly did the cargo go? And will the trends stick? Curious for answers, we asked a few analysts and examined data to find out.
Here's what we learned.
1. A rising tide lifts all ports
An import surge during the pandemic led many ports across the United States to notch record annual volumes.
By the end of 2021, the country's top 10 containerports had handled 6.8 million more TEUs than in 2019, according to data collected by Supply Chain Dive. The volume growth was twice as large as what ports had seen the preceding two years, when combined volumes had grown by 2.8 million TEUs from 2017 to 2019.
However, growth among the top 10 ports was not split evenly during the pandemic import surge, as shown below.
Most top ports had notched big volume gains by the end of 2022
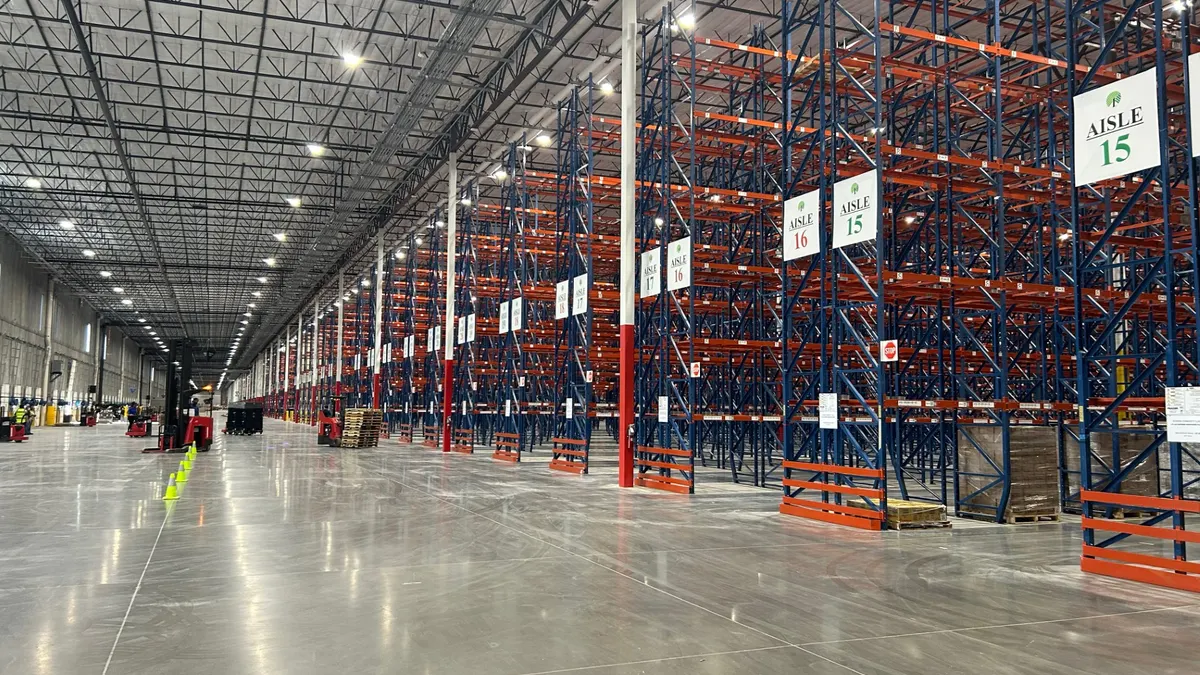
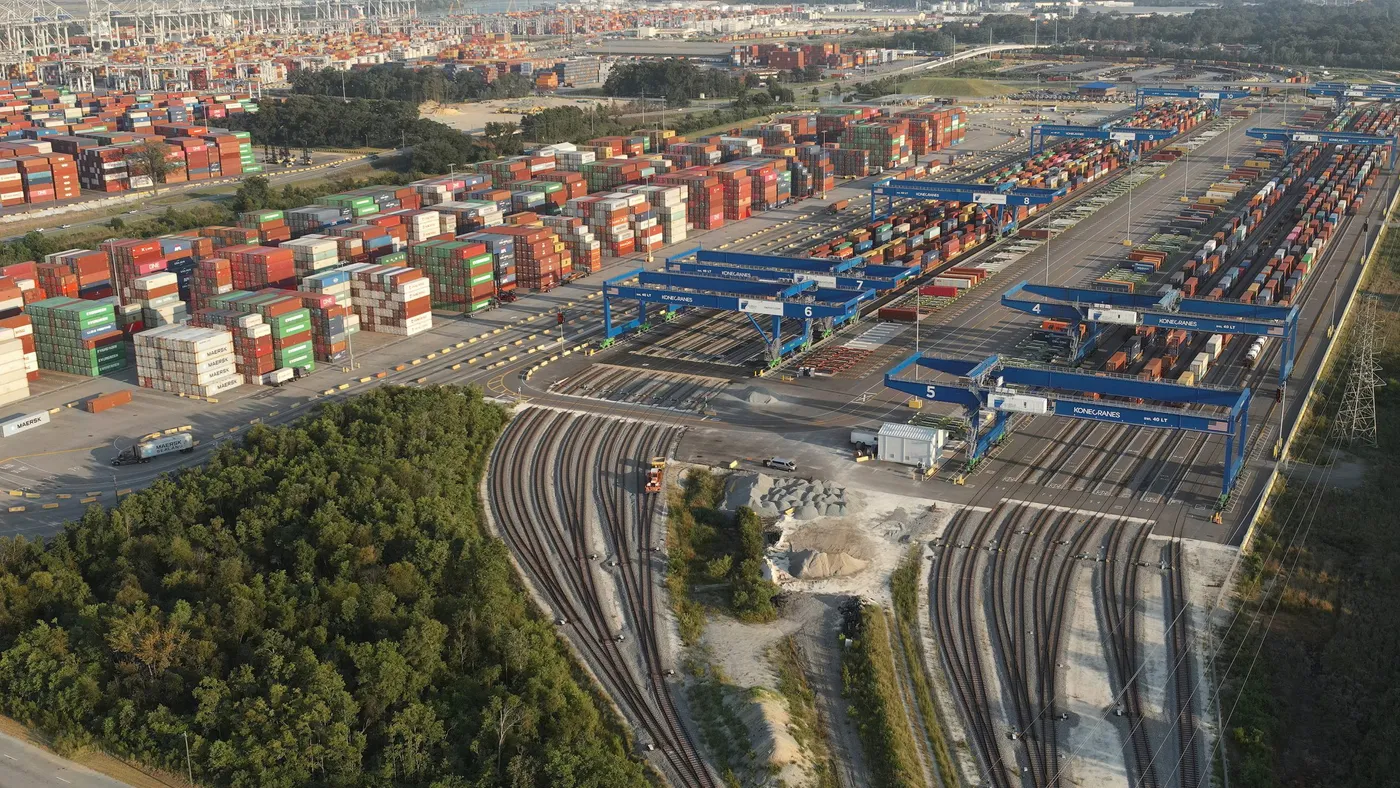
Georgia provides one example of how a fast-growing region can affect port volumes. The state’s manufacturing base, low real estate costs, and convenient location for carriers have helped make it a logistics hub, Griffith Lynch, executive director at the Georgia Ports Authority, told Supply Chain Dive earlier this year.
“Our location is central to the Southeast, we’re the closest port to a major metropolitan area in Atlanta. We have incredible rail connectivity throughout not only the Southeast, but into the Midwest,” Lynch said.
James Breeze, CBRE’s vice president and global head of industrial and logistics research, told Supply Chain Dive many markets in the southeastern U.S. are benefiting from similar trends, where population and economic growth are driving imports.
“You want to be close to that,” said Breeze. “You want to try to save on transportation costs. It's extremely expensive to import everything into Los Angeles, and then trucking it across all the way across the country.”
2. Small ports see big gains
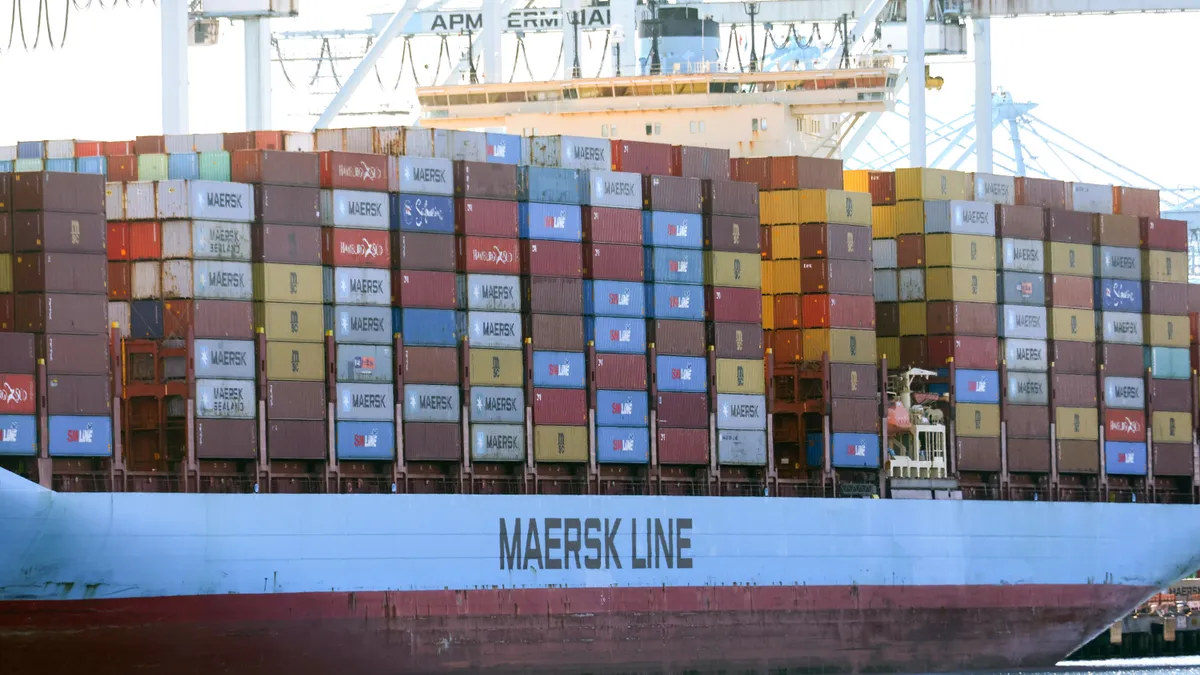
Along with greater volumes, the pandemic-driven rise in imports also brought shippers a big problem: congestion.
Prevalent delays at the nation’s top containerports, which handle over 80% of all U.S. volumes, forced shippers and carriers alike to get creative. Shipping lines altered schedules, while some cargo owners chartered ships. As congestion wore on, many companies also turned to small gateways that were a truck drive away from major ports.
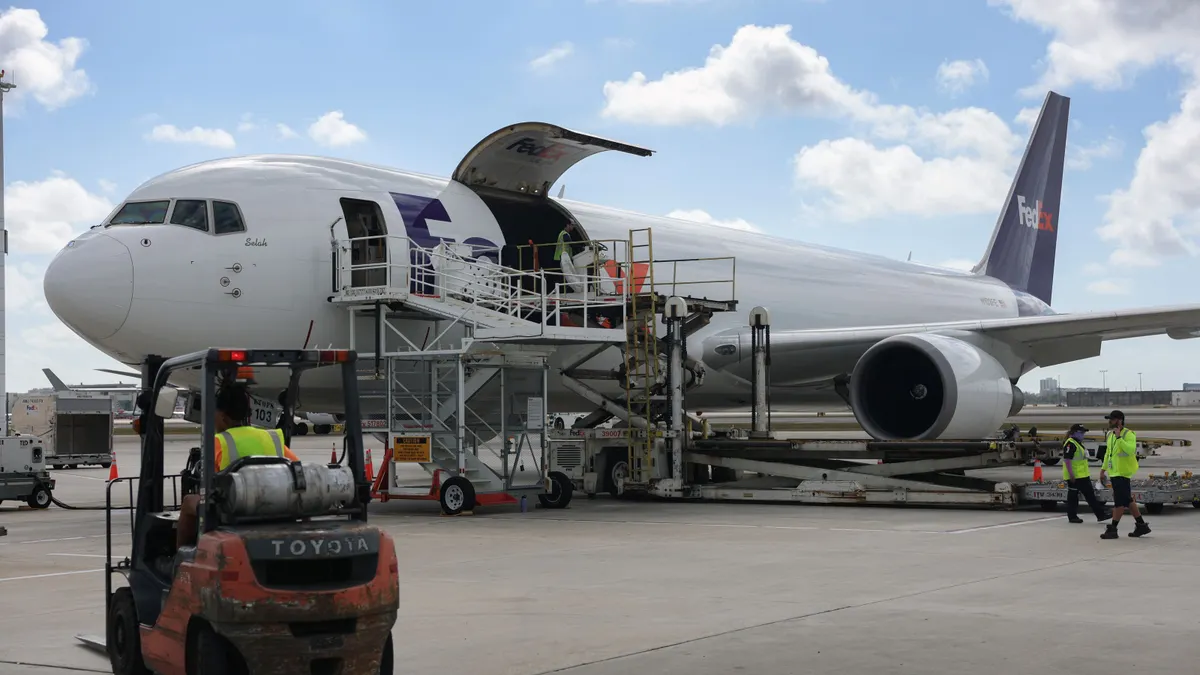
By the start of 2022, for example, FedEx Logistics had started what it called a “congestion bypass service,” selling space on empty containers being shipped to the Port of Hueneme, north of Los Angeles, to shippers looking to avoid delays at the San Pedro Bay ports.
The list of fastest growing seaports and related real estate markets in 2022, mapped below, show how other small gateways like Port Freeport, which is south of Houston, and Philadelphia’s port on the East Coast also won big from cargo shifts.
Port volumes grew fastest near existing markets
3. Longshore contract talks affect West Coast volumes
Even as congestion and demand subsided in 2022, cargo diversions did not slow down as many shippers feared another risk on the horizon: potential disruption from West Coast longshore contract talks, which began last May.
Dozens of business groups acknowledged the trend earlier this year, saying in a letter to the president cargo would not return to the West Coast until a deal was reached. The trend, combined with the effects of congestion and general demand shifts, contributed to the gains at ports on other coasts.
But how much of those gains came at the expense of West Coast ports?
More than one million TEUs each year since 2021, according to an analysis from Descartes, and most of that cargo went to Gulf Coast ports. The supply chain solutions firm also found specific commodity groups — electronics, furniture and machinery — made up a large amount of the diverted cargo.
“We would really say [Gulf Coast ports] were the big winner,” said Chris Jones, executive vice president of industry and services at Descartes. “They weren’t used to handling that kind of volume.”
Gulf Coast ports grew the most from cargo diversions
4. Cargo shifts shake up ports’ market share
The confluence of trends over the past three years dramatically affected cargo flows, reshaping the market share of the United States’ top ports along the way.
Some ports shot up in the ranks, including the ports in Houston and South Carolina, which rose in importance as they gained volumes. So, too, did the Port of New York and New Jersey, which became the nation’s second largest port by annual container volume in 2022, after seeing its volumes rise by 2 million TEUs since 2019.
West Coast ports, on the flip side, largely lost market share.
The ports in Seattle and Tacoma, represented by the Northwest Seaport Alliance, and the Port of Oakland were among the few ports that had lost volume in 2022, compared to 2019. And while the ports of Los Angeles and Long Beach gained volume, other ports’ gains chipped away at their combined market share.
Volume shifts led some ports to rapidly rise in ranks during the pandemic

Will cargo return?
Because the ports of Los Angeles and Long Beach are among the largest in the country, several analysts predicted the San Pedro Bay ports may gain back some of the volumes they lost over time.
“It’s not easy to shift trade lanes,” Descartes’ Jones said. A shipper’s ability to divert cargo depends on sailing schedules and inland transportation, such as intermodal capacity, as much as on the chosen ports. And since many shippers had their supply chains built from west to east, he said there’s some inertia to “flipping the switch.”
“Some percentage is certainly going to come back,” Jones said. “The part we’re going to watch is what percentage of that is actually going to come back. And it won’t just happen overnight.”
Similarly, CBRE’s Breeze said the Los Angeles and Long Beach ports will continue to play a vital role in U.S. supply chains.
The twin ports together handled 35% of all imports sent to the top twelve U.S. ports despite volume losses in 2022, according to data collected by Supply Chain Dive. And Breeze noted the two ports are still the closest and fastest gateway to bring goods from Asia to fast-growing markets like the U.S. Southwest.
“We're not seeing occupiers move out of Los Angeles and then move into Savannah,” said Breeze. “What they need to do now is keep that space in Los Angeles, but also add a second space in Savannah. That's part of what we call supply chain resiliency.”
Matthew Burgess, vice president of Global Ocean Services at C.H. Robinson, said shippers moving high-value or time-sensitive cargo would be the most likely to return volumes to Los Angeles and Long Beach, once the risk of contract-related disruptions at West Coast ports subsides.
But he also predicted some diversions may be permanent, particularly for shippers who prioritize cost or whose goods are not time-sensitive.
“Overall it does remain cheaper, especially if they're shipping sort of east of the Mississippi," Burgess said.